Decide which applications to keep, migrate or retire

Each application scored with the TIME model, likely duplicates flagged, and the decisions turned into a consolidation list and replacement plans with cost, savings and payback.

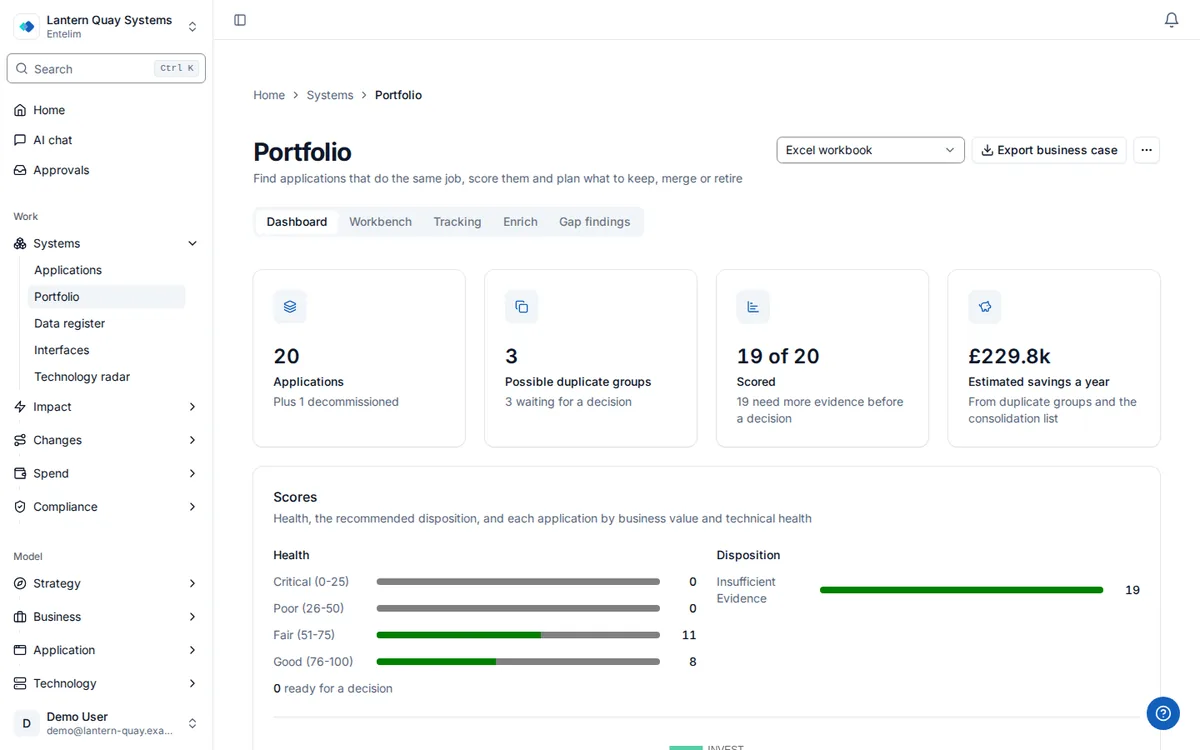
Screenshot of the rationalization dashboard with the demonstration company's applications.
The rationalization dashboard, showing which applications to keep, merge or retire.

Who it is for

Made for the people who answer for this.

  • A CIO or head of architecture asked for a smaller portfolio before the budget cycle.
  • A portfolio manager or enterprise architect who has to show why one stays and another goes.
  • A scale-up CTO who found overlapping tools.

Questions it answers

Ask it the questions you are asked.

How many of our applications are duplicates, and what do they cost?

Asked by a CIO.

Which application should we retire first, and what depends on it?

Asked by an enterprise architect.

What do we save by replacing this application?

Asked by a portfolio manager.

Why does this application stay?

Asked by a head of architecture.

How it works

From your data to an answer, in steps.

  1. Step 1

    Start from the inventory

    It reads the applications, owners, lifecycle and cost already recorded.

  2. Step 2

    Find duplicates and score

    Choose a detection strategy, then score every application from 0 to 100.

  3. Step 3

    Decide in the workbench

    Compare applications and record a disposition.

  4. Step 4

    Plan and track

    Record the replacement and retire in an order that breaks nothing.

What application rationalisation is

Application rationalisation is the process of reviewing an organisation's applications and deciding, for each one, whether to keep, consolidate, replace or retire it. The goal is a smaller, cheaper, better-understood portfolio: fewer tools doing the same job, less licence spend on systems nobody needs, and a recorded reason for every application that stays.

The TIME model is the most common way to make the decision. TIME stands for Tolerate, Invest, Migrate and Eliminate. Tolerate means keep it as it is. Invest means the application is valuable but needs work. Migrate means the value is worth keeping but the technology is obsolete. Eliminate means the application is low in value, high in cost or redundant. Each answer maps to an action you can communicate to the business: retain, refactor, replace, retire or consolidate.

The question usually starts simply and is hard to answer without data: how many of our applications are duplicates, and what do they cost? Two regional teams standardise on different tools for the same job without telling each other. A reorganisation leaves three departments each licensing their own copy of the same product. None of it shows until someone goes looking application by application, which is why most organisations run rationalisation as a deliberate exercise, once a budget cycle, rather than catching overlap as it happens.

How it works in Entelim

  1. Start from your application inventory. Rationalisation reads the applications in your Applications module, with the owner, lifecycle stage and cost fields recorded there. The more of those fields are filled in, the stronger the score. A Data Quality Health panel on the dashboard shows how complete the owner, cost, risk, lifecycle and vendor fields are across the portfolio.
  2. Find the duplicates. Choose Run Detection and pick a strategy. Fast uses name matching with acronym expansion and suits large portfolios. Hybrid combines hashing with fuzzy matching and is the recommended middle. Enhanced looks across several dimensions with business context. A similarity slider runs from 30 per cent (more results) to 100 per cent (exact matches only). Each result is a duplicate group you review, and exact matches can be resolved in one action.
  3. Score every application. Choose Score Portfolio. Each application receives an overall health score from 0 to 100, built from technical health, business value, cost efficiency and vendor risk, and a TIME recommendation. The dashboard plots the portfolio on a TIME quadrant and shows a health distribution and a disposition breakdown.
  4. Decide in the workbench. The Workbench lists every scored application with its health, disposition, readiness, review state and business unit. You can filter, compare applications side by side, open the score breakdown and act on many applications at once. An application whose key evidence is missing is marked as having insufficient evidence instead of being given a confident answer.
  5. Plan the change. Open an application's planning page to see its score breakdown, decision dossier, retirement blockers and dependency impact, then record a replacement: the replacing application, migration complexity, estimated cost, estimated annual savings, payback in months, and the status of data migration and user migration. Dispositions to retire, replace or consolidate go through architecture review board approval before they are approved.
  6. Track it to completion. The Tracking page shows portfolio dependency risk, a retirement sequence and dependency import, so you retire applications in an order that does not break the ones that depend on them. Consolidation list entries carry a target date, an estimated annual saving and an owner, and can be added to the roadmap. Export the result as Excel, CSV or an executive summary.

What you get

  • A TIME recommendation and a 0 to 100 health score for every application, with the breakdown behind it.
  • Duplicate groups from three detection strategies, with an adjustable similarity threshold.
  • A consolidation list with a recommended action, priority, target date and estimated annual saving per entry.
  • Replacement plans with migration complexity, estimated cost, estimated annual savings, payback in months, and data and user migration status.
  • A retirement sequence and dependency view, so blockers are visible before a decision is made.
  • A decision audit trail, and approval through the architecture review board for retire, replace and consolidate decisions.
  • Excel, CSV and executive summary exports for leadership.

Duplicate detection

Duplicate detection is the first step of rationalisation. It scans your application list for functional overlap and proposes candidate groups, such as two project-tracking tools or three survey platforms. The Duplicate Detection module shows the detection screen on its own. Detection proposes; a person decides. Nothing is merged or retired until someone approves it. The question of what you pay for twice is answered in full on duplicate software spend, which reads the same duplicate groups alongside contracts.

Limits

Detection proposes candidates. It matches on names and recorded attributes, so two applications with different names and the same function will only appear if the record describes them alike.

Savings and payback on a replacement plan are the figures you enter. Entelim does not estimate them for you from market prices.

The score is only as good as the fields behind it. Where the owner, cost or risk is missing, the application is flagged for insufficient evidence instead of scored with a guess.

Entelim does not discover applications on your network. The inventory is what you enter or import. Pair rationalisation with Procurement for the contracts and renewal dates that decide when a retirement can take effect.

Plan

Rationalisation is available in the self-hosted edition and on the hosted plans, which differ by how many people can edit. See Entelim pricing, or compare Entelim with LeanIX.

Start today

Connect your tools. Get a cited answer.

Free for up to three people, with no trial clock. Self-host it free under AGPL-3.0, at any size.